|
|
THIRD ESTATE: In past centuries, this included the peasants, serfs, or slaves who performed the dirty deeds for the ruling elite. In modern times, this is the workers, taxpayers, and consumers who have limited ownership of and control over resources usually nothing more than their own labor. The third estate, which forms the backbone of any modern economy, is usually at odds with the business leaders of the second estate. Help may come from the government leaders of the first estate or the journalist of the fourth estate--but don't count on it.
Visit the GLOSS*arama
|
|


|

|
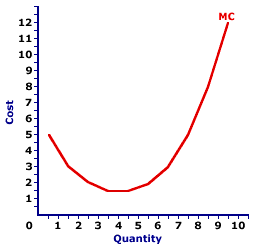
                           MARGINAL COST CURVE: A curve that graphically represents the relation between the marginal cost incurred by a firm in the short-run product of a good or service and the quantity of output produced. This curve is constructed to capture the relation between marginal cost and the level of output, holding other variables like technology and resource prices constant. Three related curves are average total cost curve, average variable cost curve, and average fixed cost curve. The marginal cost curve, the graphical relation between marginal cost and output, is U-shaped. Marginal cost is relatively high at small quantities of output, then as production increases, it declines, reaches a minimum value, then rises once again.This U shape is directly attributable to increasing, then decreasing marginal returns (and the law of diminishing marginal returns). As marginal product (and marginal returns) increases for relatively small output quantities, marginal cost declines. Then as marginal product (and marginal returns) decreases with the law of diminishing marginal returns for relatively large output quantities, marginal cost increases. | Marginal Cost Curve |  |
The graph presented at the right is the marginal cost curve for the short-run production of Wacky Willy Stuffed Amigos (those cute and cuddly scorpions and turtles). The quantity of Stuffed Amigos production, measured on the horizontal axis, ranges from 0 to 10 and the marginal cost incurred in the production of Stuffed Amigos, measured on the vertical axis, starts at $5, declines to $1.50, then rises again to $12.The marginal cost curve is U-shaped. For the first 4 Stuffed Amigos, marginal cost declines from $5 to a low of $1.50. However, for the production beyond 6 Stuffed Amigos, marginal cost increases. The source of this U-shaped marginal cost curve rests with increasing and decreasing marginal returns. In fact, the negatively-sloping portion of the marginal cost curve coincides exactly with increasing marginal returns in production Stage I. The positively-sloping portion of the marginal cost curve coincides exactly with decreasing marginal returns in production Stage II. The marginal cost curve takes center stage in the analysis of a firm's short-run production. In particular, a profit-maximizing firm equates the marginal revenue received from selling a good with the marginal cost of producing it. For a firm operating under perfect competition, its marginal cost curve becomes its supply curve. The marginal cost curve, because it measures the incremental opportunity cost of producing one more unit of a good plays, an important role in analyzing the efficient allocation of resources.

Recommended Citation:MARGINAL COST CURVE, AmosWEB Encyclonomic WEB*pedia, http://www.AmosWEB.com, AmosWEB LLC, 2000-2025. [Accessed: July 18, 2025].
Check Out These Related Terms... | | | | | | | | | | | | | | | | | |
Or For A Little Background... | | | | | | | | | | | | |
And For Further Study... | | | | | | | | | | | | | | | |
Search Again?
Back to the WEB*pedia
|


|

|
|
In the early 1900s around 300 automobile companies operated in the United States.
|

|
|
"A winner is someone who recognizes his God-given talents, works his tail off to develop them into skills, and uses those skills to accomplish his goals. " -- Larry Bird, basketball player
|

|
LME
London Metal Exchange
|

|
|
Tell us what you think about AmosWEB. Like what you see? Have suggestions for improvements? Let us know. Click the User Feedback link.
User Feedback
|


|


