|
|
MARGINALLY-ATTACHED WORKERS: People who are willing and able to work, who have either held a job or searched for employment within the last year, but are not actively seeking employment. Discouraged workers, people who are willing and able to engage in productive activities, but due to their overwhelming lack of success believe that any effort to find a job will be fruitless so they have stopped seeking employment, fall within this broader category of marginally-attached workers. People can be marginally attached to the labor force for a variety of reasons, discouraged workers, in contrast, achieve their designation specifically because they believe search efforts would not be worthwhile.
Visit the GLOSS*arama
|
|


|

|
                           MARGINAL FACTOR COST, MONOPSONY: The change in total factor cost resulting from a change in the quantity of factor input employed by a monopsony. Marginal factor cost, abbreviated MFC, indicates how total factor cost changes with the employment of one more input. It is found by dividing the change in total factor cost by the change in the quantity of input used. Marginal factor cost is compared with marginal revenue product to identify the profit-maximizing quantity of input to hire. Marginal factor cost is the extra cost incurred when a monopsony buys one more unit of an input. It plays THE key role in the study of factor markets and the profit maximizing decision of a monopsony relative to marginal revenue product. A monopsony maximizes profit by equating marginal revenue product, the extra revenue generated from using an input, with marginal factor cost, the extra cost incurred by using the input. If these two marginals are not equal, then profit can be increased by hiring more or less input.The relation between marginal factor cost and quantity of input used depends on market structure. For a perfectly competitive firm, marginal factor cost is equal to factor price and average factor cost, all of which are constant. For a monopoly, monopolistically competitive, or oligopoly firm, marginal factor cost is greater than average factor cost and factor price, all of which increase with larger quantities of input. The constant or increasing nature of marginal factor cost is a prime indication of the market control of a firm. Whichever market structure is involved, marginal factor cost is calculated as the change in total factor cost divided by the change in the quantity of the factor purchased, as illustrated by this equation: | marginal factor cost | = | change in total factor cost
change in factor quantity |
If the firm is hiring the factor in a perfectly competitive factor market, then the factor price is fixed or constant and so too is marginal factor cost. If the firm is hiring the factor in an imperfectly competitive factor market, best illustrated by monopsony, then the factor price increases with larger factor quantities and so too does marginal factor cost. Monopsony is a market structure with a single buyer or in terms of factor markets, a single employer. This means that monopsony is a price maker, with control over the buying side of the market. Market control means monopsony faces a positively-sloped supply curve. To buy a larger quantity, it must pay a higher price. Marginal Factor Cost,
Monopsony |  |
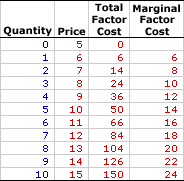
The table to the right summarizes the marginal factor cost received by a hypothetical firm, OmniKing Island Resort. This firm is the only employer of labor on a small tropical island. As the only employer on the island, OmniKing is a monopsony with extensive market control, and it faces a positively-sloped supply curve. To employ more workers, OmniKing must pay a higher price.The first column in the table is the quantity of workers hired, ranging from 0 to 10 workers. The second column is the price OmniKing pays for hiring workers, which increases from a low of $5 for 0 workers to a high of $15 for 10 workers. The third column is the total factor cost OmniKing incurs for hiring various numbers of workers. If OmniKing hires only one worker, then it pays only $5. If it hires five workers, it pays $50. In each case, total factor cost in column three is calculated as the quantity in the first column multiplied by the price in the second column. The fourth column then presents the marginal factor cost incurred by OmniKing at each level of employment. These numbers are found by dividing the change in total factor cost in the third column by the change in factor quantity in the first column. For example, the total factor cost of hiring the fifth worker over the fourth increases from $36 to $50, resulting in a marginal factor cost of $14 (=$14/1). The two key observations about marginal factor cost are: - First, marginal factor cost is not constant, but increases as the level of employment increases.
- Second, marginal factor cost is greater than price (which is also average factor cost) at every level of employment. Marginal factor cost is greater than price because OmniKing must increase the price paid to all workers when it raises the price to hire an additional worker.
Marginal Factor Cost Curve,
Monopsony |  |
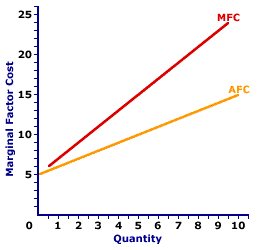
The marginal factor cost curve (MFC) for OmniKing Island Resort is displayed in the exhibit to the right. Key to this curve is that OmniKing is a monopsony buyer of workers and thus faces a positively-sloped supply curve. Larger quantities of input can be had only with higher prices.The vertical axis measures marginal factor cost and the horizontal axis measures the quantity of input (workers). Although quantity on this particular graph stops at 10 workers, it could go higher. This curve indicates that if OmniKing hires the first worker, then marginal factor cost is $6. Alternatively, if it hires the tenth worker, then marginal factor cost is $24. For reference, the factor supply curve (and average factor cost curve, AFC) is also presented in the exhibit. The key observation is that the positively-sloped marginal factor cost curve (MFC) lies above the supply curve (AFC) facing OmniKing for hiring labor. The positioning of the marginal factor cost curve above the average factor cost curve reflects the mathematical relation between an average and a marginal. Although this marginal factor cost curve, and preceding table of marginal factor cost numbers, is based on the employment activity of OmniKing Island Resort, a well-known monopsony firm, it works for any buyer with market control. Monopsonistic competition and oligopsony firms that also face positively-sloped supply curves generate comparable total factor costs.

Recommended Citation:MARGINAL FACTOR COST, MONOPSONY, AmosWEB Encyclonomic WEB*pedia, http://www.AmosWEB.com, AmosWEB LLC, 2000-2025. [Accessed: July 18, 2025].
Check Out These Related Terms... | | | | | | | | | |
Or For A Little Background... | | | | | | | | | | | |
And For Further Study... | | | | | | | | |
Search Again?
Back to the WEB*pedia
|


|

|
WHITE GULLIBON
[What's This?]
Today, you are likely to spend a great deal of time searching the newspaper want ads seeking to buy either an extra large beach blanket or a large flower pot shaped like a Greek urn. Be on the lookout for fairy dust that tastes like salt.
Your Complete Scope
This isn't me! What am I?
|

|
|
In his older years, Andrew Carnegie seldom carried money because he was offended by its sight and touch.
|

|
|
"A winner is someone who recognizes his God-given talents, works his tail off to develop them into skills, and uses those skills to accomplish his goals. " -- Larry Bird, basketball player
|

|
AMB
Adjusted Monetary Base
|

|
|
Tell us what you think about AmosWEB. Like what you see? Have suggestions for improvements? Let us know. Click the User Feedback link.
User Feedback
|


|


