|
|
ECONOMIC RENT: The difference between the payment received by a resource owner and the opportunity cost of the resource. This is the payment received by a resource owner over and above the minimum needed to produce a good. Many resource owners are able to extract a portion of the economic profit generated by a business as a economic rent.
Visit the GLOSS*arama
|
|


|

|
                           AGGREGATE MARKET ANALYSIS: An investigation of macroeconomic phenomena, including unemployment, inflation, business cycles, and stabilization policies, using the aggregate market interaction between aggregate demand, short-run aggregate supply, and long-run aggregate supply. Aggregate market analysis, also termed AS-AD analysis, has been the primary method of macroeconomic analysis since replacing Keynesian economics in the 1980s. Like most economic analysis, aggregate market analysis employs comparative statics, the technique of comparing the equilibrium after a shock with the equilibrium before a shock. Aggregate market analysis is the primary method of macroeconomic analysis. Like most forms of economic analysis, it combines two opposing forces. The two opposing forces in the aggregate market take their inspiration from standard market analysis--aggregate demand and aggregate supply. Both are relations between the price level and real production.- Aggregate demand is the inverse relation between the price level and aggregate expenditures on real production. The aggregate expenditures are commonly separated by macroeconomic sectors--consumption expenditures by the household sector, investment expenditures by the business sector, government purchases by the government sector, and net exports by the foreign sector. Aggregate demand traces out a negatively-sloped aggregate demand curve with changes in the price level.
- Aggregate supply is actually two separate relations between the price level and real production--one short run and one long run. Short-run aggregate supply is a direct relation based on inflexible or rigid prices and is seen by a positively-sloped short-run aggregate supply curve. Long-run aggregate supply is an independent relation based on flexible prices and is represented by a vertical long-run aggregate supply curve.
The Graphical Model| The Aggregate Market |  |
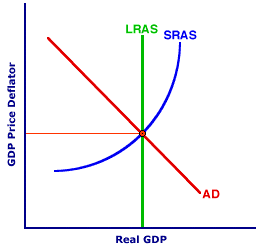
The exhibit to the right illustrates the basic components of the aggregate market. The vertical axis measures the price level (GDP price deflator) and the horizontal axis measures real production (real GDP). The negatively-sloped curve, labeled AD, is the aggregate demand curve; the positively-sloped curve, labeled SRAS, is the short-run aggregate supply curve; and the vertical curve, labeled LRAS, is the long-run aggregate supply curve.A few more words are in order about each curve. - Aggregate Demand: The aggregate demand curve (AD) is negatively sloped for three reasons--interest-rate effect, real-balance effect, and net-export effect. A change in the price level induces changes in consumption expenditures, investment expenditures, government purchases, and/or net exports due to a change in interest rates, a change in the purchasing power of money, or a change in domestic prices relative to foreign prices.
- Short-Run Aggregate Supply: The short-run aggregate supply curve (SRAS) is positively sloped for three reasons of its own--real wage adjustment, real wage misperception, and natural unemployment adjustment. A change in the price level induces changes in real production due to different adjustments between the nominal wage and the price level, misperception of adjustments between the nominal wage and the price level, and temporary reductions of frictional and structural unemployment.
- Long-Run Aggregate Supply: The long-run aggregate supply curve (LRAS) is vertical for one reason and only one reason--flexible prices. Price flexibility means that a change in the price level does not cause a change in real production because resource markets remain at their full-employment equilibrium levels.
The analytical value of this aggregate market model begins with equilibrium, especially identifying the equilibrium price level and equilibrium quantity of real production. In this exhibit, equilibrium is identified by the intersection of the three curves. Equilibrium: Short-Run and Long-Run| Long-Run Equilibrium |  | Short-Run Equilibrium |  |
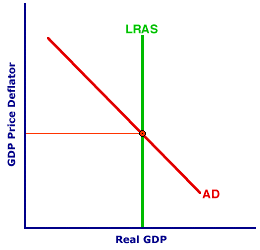
Equilibrium achieved at the intersection of all three curves is actually only one of two equilibrium alternatives for the aggregate market--long-run equilibrium and short-run equilibrium- Long-run equilibrium, illustrated in the top panel of the exhibit to the right, is the intersection of the aggregate demand curve and the long-run aggregate supply curve. It is based on the simultaneous equilibrium in three aggregated markets, product, financial, and resource.
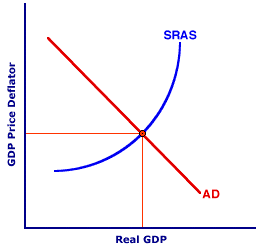
- Short-run equilibrium, illustrated in the bottom panel of the exhibit to the right, is the intersection of the aggregate demand curve and the short-run aggregate supply curve. It is based on equilibrium in the product and financial markets, but disequilibrium in the resource markets.
Macroeconomic PhenomenaAlthough aggregate market equilibrium is a handy concept, perhaps more important and more informative, the model is used to analyze how shifts of the three aggregate curves affect the equilibrium price level and equilibrium real production.Information about the price level and real production, which are identified directly from the aggregate market model, is certainly important in its own right. However, implications about other macroeconomic activity can be derived as well. Changes in the price level, for example, provide insight into inflation, which is the percentage change in the price level. Moreover, real production provides insight into income, employment, and unemployment. Income is earned by generating production. As real production changes, so too does real income. Resources, especially labor, are used to generate real production. As real production changes, so too does employment. Perhaps most important of all, the level of real production relative to full-employment real production (which is marked by the vertical LRAS curve) indicates unemployment. Unemployment increases or decreases when real production is less than or greater than full-employment real production. Comparative Statics| Comparative Statics | 
|
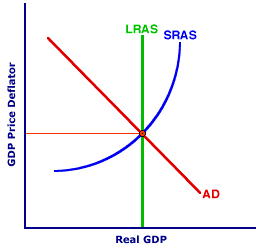
Comparative statics, the basic analytical technique used throughout the study of economics, is also a key to aggregate market analysis. The equilibrium price level and real production that exists before the aggregate market is shocked by a change in one or more determinants is compared with equilibrium values that emerge after the shock. Comparison of one equilibrium to another provides insight into what causes such things inflation, business cycles, and economic growth.Consider a simple example in which the aggregate market is shocked by a change in aggregate demand. Changes in aggregate demand are commonly associated with business-cycle instability. To see how the aggregate market is used to analyze an increase in aggregate demand, click the [AD Increase] button. Doing so reveals a rightward shift of the aggregate demand curve. This results in a new short-run equilibrium at a higher price level and a larger quantity of real production, just the sort of thing expected with a business-cycle expansion. Of course, the other side of a business cycle is a contraction that can be explained by a decrease in aggregate demand. Click the [AD Decrease] button to see how the aggregate market is used to analyze this alternative. Doing so reveals a leftward shift of the aggregate demand curve, which results in a short-run new equilibrium at a lower price level and a smaller quantity of real production, the hallmarks of a contraction. Doing Some AnalysisWhile shifts and shocks of the aggregate demand curve often take center stage in aggregate market analysis, each of the three curves making up this model have important roles to play. Consider examples of each.- AD Curve: In addition to shifts reflecting business-cycle expansions and contractions, the AD curve plays a prime role in the analysis of stabilization policies, including fiscal policy and monetary policy, that are designed to counter business-cycle instability. Such policies also cause the AD curve to shift.
- LRAS Curve: The LRAS curve marks full-employment real production for the economy. Shifts in this curve are caused by changes in the quantities and qualities of resources. The most important phenomenon analyzed by such changes is economic growth.
- SRAS Curve: A key analytical task falling on the SRAS curve is the self-correction mechanism of the macroeconomy. While the economy might be able to remain above or below full employment in the short run, changing resource prices automatically return it to full employment in the long run. This phenomenon is represented by shifts in the SRAS curve.

Recommended Citation:AGGREGATE MARKET ANALYSIS, AmosWEB Encyclonomic WEB*pedia, http://www.AmosWEB.com, AmosWEB LLC, 2000-2025. [Accessed: July 18, 2025].
Check Out These Related Terms... | | | | | | | | | |
Or For A Little Background... | | | | | | | | | | | | |
And For Further Study... | | | | | | | | | | | |
Search Again?
Back to the WEB*pedia
|


|

|
BLUE PLACIDOLA
[What's This?]
Today, you are likely to spend a great deal of time searching the newspaper want ads looking to buy either a wall poster commemorating the first day of winter or blue cotton balls. Be on the lookout for rusty deck screws.
Your Complete Scope
This isn't me! What am I?
|

|
|
A U.S. dime has 118 groves around its edge, one fewer than a U.S. quarter.
|

|
|
"A winner is someone who recognizes his God-given talents, works his tail off to develop them into skills, and uses those skills to accomplish his goals. " -- Larry Bird, basketball player
|

|
JGB
Japanese Government Bond
|

|
|
Tell us what you think about AmosWEB. Like what you see? Have suggestions for improvements? Let us know. Click the User Feedback link.
User Feedback
|


|


