|
|
PERFECT COMPETITION, LOSS MINIMIZATION: A perfectly competitive firm is presumed to produce the quantity of output that minimizes economic losses, if price is greater than average variable cost but less than average total cost. This is one of three short-run production alternatives facing a firm. The other two are profit maximization (if price exceeds average total cost) and shutdown (if price is less than average variable cost).
Visit the GLOSS*arama
|
|


|

|
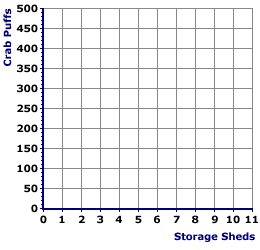
                           DERIVATION, PRODUCTION POSSIBILITIES CURVE: A production possibilities curve, which illustrates the alternative combinations of two goods that an economy can produce with given resources and technology, is often derived from a production possibilities schedule. This derivation involves plotting each bundle from the production possibilities schedule as a point in a diagram measuring the two goods on the vertical and horizontal axes. Plotting a production possibilities curve from a production possibilities schedule provides useful insight into graphical analysis commonly used throughout the study of economics.The Plotting Space| Plotting Space |  |
The first step in the derivation of a production possibilities curve is to set up the plotting space. - Each bundle in the production possibilities schedule is a combination of two numbers that can be represented by a point in two-dimensional production possibilities space.
- The two dimensions of the plotting space displayed here are storage sheds on the horizontal axis and crab puffs on the vertical axis.
- The horizontal axis is measured between 0 and 11 storage sheds.
- The vertical axis is measured between 0 and 500 dozen crab puffs.
- The two axes are joined at the origin.
The mouse arrow can be used to display the various components of the production possibilities plotting space.Plotting the PointsThe next step in converting the production possibilities schedule on the left to the graph on the right is to plot points corresponding to each bundle of sheds and crab puffs into the plotting space.
Production Possibilities
Schedule | Production Possibilities
Curve |  |  | |
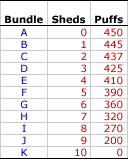
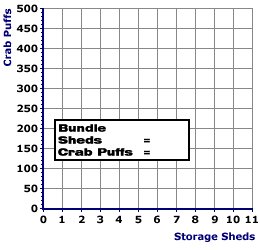
- Bundle A: The first bundle in the schedule (A) consists of 0 sheds and 450 dozen crab puffs. This point can be plotted by finding 0 sheds on the horizontal axis then moving up until the value of 450 dozen crab puffs is reached on the vertical axis. Click the [Plot A] button to identify this point.
- Bundle B: The second bundle in the schedule (B) is 1 shed and 445 dozen crab puffs. This point can be similarly plotted by finding 1 shed on the horizontal axis then moving up until the value of 445 dozen crab puffs is reached on the vertical axis. Click the [Plot B] button to identify this point.
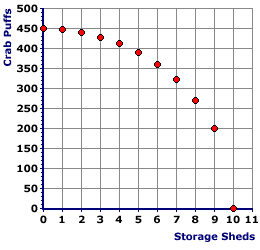
- The Rest: All remaining points can be plotted in a similar fashion. To illustrate this click the [Plot All] button. The third bundle and corresponding point (C) is 2 sheds and 437 dozen crab puffs. The fourth bundle and point (D) is 3 sheds and 425 dozen crab puffs. The plotting continues until reaching the last bundle and point (K), which is 10 sheds and 0 crab puffs.
- The end result of plotting all 11 points is a semi-circular pattern. The pattern of points has a general downward "slope." This indicates the essential tradeoff between the production of sheds and crab puffs. These points represent the "skeleton" of what is called a production possibilities curve.
Connecting the Points| Connecting the Points |  |
The last step in the derivation of the production possibilities curve is to connect the points with a continuous line. The eleven points are only a few of an unlimited number of production alternatives. The line that connects these 11 points includes the other possibilities, an infinite number of production possibilities. - To connect the points, click the [Draw] button in the exhibit to the right. This draws a straight line between each pair of adjacent points.
- However, the actual curve is not a series of jagged line segments, but a smooth curve. To smooth this curve, click the [Smooth] button.
- The curve is termed the production possibilities curve or the production possibilities frontier.

Recommended Citation:DERIVATION, PRODUCTION POSSIBILITIES CURVE, AmosWEB Encyclonomic WEB*pedia, http://www.AmosWEB.com, AmosWEB LLC, 2000-2025. [Accessed: July 18, 2025].
Check Out These Related Terms... | | | | | | | | |
Or For A Little Background... | | | | | | | | | |
And For Further Study... | | | | | | | | | | | | |
Search Again?
Back to the WEB*pedia
|


|

|
BLACK DISMALAPOD
[What's This?]
Today, you are likely to spend a great deal of time browsing about a thrift store seeking to buy either a genuine fake plastic Tiffany lamp or a microwave over that won't burn your popcorn. Be on the lookout for small children selling products door-to-door.
Your Complete Scope
This isn't me! What am I?
|

|
|
A communal society, a prime component of Karl Marx's communist philosophy, was advocated by the Greek philosophy Plato.
|

|
|
"A winner is someone who recognizes his God-given talents, works his tail off to develop them into skills, and uses those skills to accomplish his goals. " -- Larry Bird, basketball player
|

|
NLLS
Nonlinear Least Squares
|

|
|
Tell us what you think about AmosWEB. Like what you see? Have suggestions for improvements? Let us know. Click the User Feedback link.
User Feedback
|


|


