
|
|
ADAM SMITH: A Scottish professor (born 1723, died 1790) who is considered the father of modern economics for his revolutionary book, entitled An Inquiry into the Nature and Causes of the Wealth of Nations published in 1776.
Visit the GLOSS*arama
|
|


|

|
                           AVERAGE FACTOR COST CURVE, MONOPSONY: A curve that graphically represents the relation between average factor cost incurred by a firm for employing an input and the quantity of input used. Because average factor cost is essentially the price of the input, the average factor cost curve is also the supply curve for the input. The average factor cost curve for a firm with no market control is horizontal. The average factor cost curve for a firm with market control is positively sloped. Monopsony is a market structure with a single buyer or in terms of factor markets, a single employer. This means that monopsony is a price maker, with control over the buying side of the market. Market control means monopsony faces a positively-sloped supply curve. To buy a larger quantity, it must pay a higher price.The average factor cost curve reflects the degree of market control held by a firm. For a perfectly competitive firm with no market control, the average factor cost curve is a horizontal line. For firms with market control, especially monopsony, the average factor cost curve is positively sloped. Average Factor Cost Curve,
Monopsony | 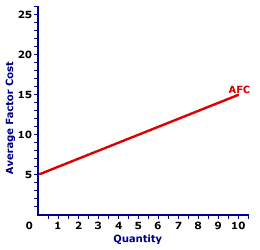 |
The exhibit to the right displays the average factor cost curve for a hypothetical firm, OmniKing Island Resort. This firm is the only employer of labor on a small tropical island. As the only employer on the island, OmniKing is a monopsony with extensive market control, and it faces a positively-sloped supply curve. To employ more workers, OmniKing must pay a higher price.The vertical axis measures total factor cost and the horizontal axis measures the quantity of input (workers). Although quantity on this particular graph stops at 10 workers, it could go higher. This curve indicates that if OmniKing hires 1 worker (at $6 per worker), then it incurs $6 of average factor cost. Alternatively, if it hires 10 workers (at $15 per worker), then it pays $15 of average factor cost. This positively-sloped average factor cost curve is actually nothing more than the supply curve facing OmniKing for hiring labor. In the analysis of factor markets, the average factor cost curve and the supply curve facing the firm are almost always one and the same. Although this average factor cost curve is based on the employment activity of OmniKing Island Resort, a well-known monopsony firm, they apply to any buyer with market control. Monopsonistic competition and oligopsony firms that also face positively-sloped supply curves generate comparable average factor costs.
Recommended Citation:AVERAGE FACTOR COST CURVE, MONOPSONY, AmosWEB Encyclonomic WEB*pedia, http://www.AmosWEB.com, AmosWEB LLC, 2000-2025. [Accessed: July 18, 2025].
Check Out These Related Terms... | | | | | | | | | | |
Or For A Little Background... | | | | | | | | | | | |
And For Further Study... | | | | | | | | |
Search Again?
Back to the WEB*pedia
|

|

|
PINK FADFLY
[What's This?]
Today, you are likely to spend a great deal of time calling an endless list of 800 numbers wanting to buy either a weathervane with a cow on top or a box of multi-colored, plastic paper clips. Be on the lookout for high interest rates.
Your Complete Scope
This isn't me! What am I?
|

|
|
The first U.S. fire insurance company was established by Benjamin Franklin in 1752 in Philadelphia.
|

|
|
"A winner is someone who recognizes his God-given talents, works his tail off to develop them into skills, and uses those skills to accomplish his goals. " -- Larry Bird, basketball player
|

|
HSB
High School and Beyond
|

|
|
Tell us what you think about AmosWEB. Like what you see? Have suggestions for improvements? Let us know. Click the User Feedback link.
User Feedback
|

|

