
|
|
YIELD: The rate of return on a financial asset. In some simple cases, the yield on a financial asset, like commercial paper, corporate bond, or government security, is the asset's interest rate. However, as a more general rule, the yield includes both the interest earned from an asset plus any changes in the asset's price. Suppose, for example, that a $100,000 bond has a 10 percent interest rate, such that the holder receives $10,000 interest per year. If the price of the bond increases over the course of the year from $100,000 to $105,000, then the bond's yield is greater than 10 percent. It includes the $10,000 interest plus the $5,000 bump in the price, giving a yield of 15 percent. Because bonds and similar financial assets often have fixed interest payments, their prices and subsequently yields move up and down as economic conditions change.
Visit the GLOSS*arama
|
|


|

|
                           AVERAGE REVENUE CURVE, PERFECT COMPETITION: A curve that graphically represents the relation between average revenue received by a perfectly competitive firm for selling its output and the quantity of output sold. Because average revenue is essentially the price of a good, the average revenue curve is also the demand curve for a perfectly competitive firm's output. Perfect competition is a market structure with a large number of small firms, each selling identical goods. Perfectly competitive firms have perfect knowledge and perfect mobility into and out of the market. These conditions mean perfectly competitive firms are price takers, they have no market control and receive the going market price for all output sold.The average revenue curve reflects the degree of market control held by a firm. For a perfectly competitive firm with no market control, the average revenue curve is a horizontal line. For firms with market control, especially monopoly, the average revenue curve is negatively-sloped. Average Revenue Curve,
Zucchini Style | 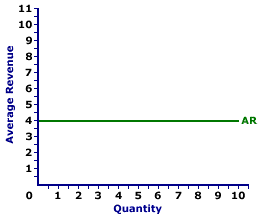 |
Average revenue is commonly represented by an average revenue curve, such as the one displayed in the exhibit to the right. This particular average revenue curve is that for zucchini sales by Phil the zucchini grower, a presumed perfectly competitive firm. The vertical axis measures average revenue and the horizontal axis measures the quantity of output (pounds of zucchinis). Although quantity on this particular graph stops at 10 pounds of zucchinis, the nature of perfect competition indicates it could easily go higher. This curve indicates that if Phil sells 1 pound of zucchinis, then his revenue per unit is $4. However, if he sells 10 pounds, then he also receives $4 of average revenue. Should he sell 100 pounds, then he moves well beyond the graph, but his average revenue remains at $4. The average revenue curve is actually the demand curve for Phil's zucchinis. In fact, in the same way that average revenue is just another term for price, the average revenue curve is just another term for demand curve.
Recommended Citation:AVERAGE REVENUE CURVE, PERFECT COMPETITION, AmosWEB Encyclonomic WEB*pedia, http://www.AmosWEB.com, AmosWEB LLC, 2000-2025. [Accessed: July 18, 2025].
Check Out These Related Terms... | | | | | | | | |
Or For A Little Background... | | | | | | | | | | | |
And For Further Study... | | | | | | | | |
Related Websites (Will Open in New Window)... | | | |
Search Again?
Back to the WEB*pedia
|

|

|
PINK FADFLY
[What's This?]
Today, you are likely to spend a great deal of time calling an endless list of 800 numbers wanting to buy either a weathervane with a cow on top or a box of multi-colored, plastic paper clips. Be on the lookout for high interest rates.
Your Complete Scope
This isn't me! What am I?
|

|
|
Lombard Street is London's equivalent of New York's Wall Street.
|

|
|
"A winner is someone who recognizes his God-given talents, works his tail off to develop them into skills, and uses those skills to accomplish his goals. " -- Larry Bird, basketball player
|

|
JEMS
Journal of Economics and Management Strategy
|

|
|
Tell us what you think about AmosWEB. Like what you see? Have suggestions for improvements? Let us know. Click the User Feedback link.
User Feedback
|

|

