|
|
BIS: The Bank for International Settlements (BIS) is an international organization which fosters cooperation among central banks and other agencies in pursuit of monetary and financial stability. Established in 1930, the BIS is the world's oldest international financial organization. The head office is in Basel, Switzerland and there are two representative offices: in the Hong Kong, China and in Mexico City. As its customers are central banks, the BIS cannot accept deposits from, or provide financial services to, private individuals or corporate entities.
Visit the GLOSS*arama
|
|


|

|
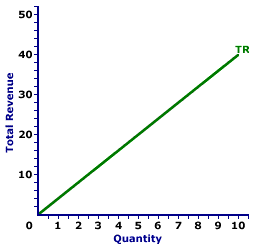
                           TOTAL REVENUE CURVE, PERFECT COMPETITION: A curve that graphically represents the relation between the total revenue received by a perfectly competitive firm for selling its output and the quantity of output sold. It is combined with a perfectly competitive firm's total cost curve to determine economic profit and the profit maximizing level of production. The slope of the total revenue curve is marginal revenue. Perfect competition is a market structure with a large number of small firms, each selling identical goods. Perfectly competitive firms have perfect knowledge and perfect mobility into and out of the market. These conditions mean perfectly competitive firms are price takers, they have no market control and receive the going market price for all output sold.The total revenue curve reflects the degree of market control held by a firm. For a perfectly competitive firm with no market control, the total revenue curve is a straight line. For firms with more market control, especially monopoly, the total revenue curve is "hump shaped," increasing, reaching a peak, then declining. The slope of this total revenue curve is marginal revenue. Total Revenue Curve,
Zucchini Style |  |
Total revenue is commonly represented by a total revenue curve, such as the one displayed in the exhibit to the right. This particular total revenue curve is that for zucchini sales by Phil the zucchini grower. The vertical axis measures total revenue and the horizontal axis measures the quantity of output (pounds of zucchinis). Although quantity on this particular graph stops at 10 pounds of zucchinis, the nature of perfect competition indicates it could go higher. This curve indicates that if Phil sells 1 pound of zucchinis, then he receives $4 of total revenue. Alternatively, if he sells 10 pounds, then he receives $40 of total revenue. Should he sell 100 pounds, then he would move well beyond the graph, with $400 of total revenue. The "curve" is actually a "straight line" because Phil is a price taker in the zucchini market. He receives $4 for each pound of zucchinis sold whether he sells 1 pound or 10 pounds. The constant price is what makes Phil's total revenue curve a straight line.

Recommended Citation:TOTAL REVENUE CURVE, PERFECT COMPETITION, AmosWEB Encyclonomic WEB*pedia, http://www.AmosWEB.com, AmosWEB LLC, 2000-2025. [Accessed: July 18, 2025].
Check Out These Related Terms... | | | | | | | | |
Or For A Little Background... | | | | | | | | |
And For Further Study... | | | | | | | | |
Related Websites (Will Open in New Window)... | | | |
Search Again?
Back to the WEB*pedia
|


|

|
PINK FADFLY
[What's This?]
Today, you are likely to spend a great deal of time calling an endless list of 800 numbers wanting to buy either a weathervane with a cow on top or a box of multi-colored, plastic paper clips. Be on the lookout for high interest rates.
Your Complete Scope
This isn't me! What am I?
|

|
|
A thousand years before metal coins were developed, clay tablet "checks" were used as money by the Babylonians.
|

|
|
"A winner is someone who recognizes his God-given talents, works his tail off to develop them into skills, and uses those skills to accomplish his goals. " -- Larry Bird, basketball player
|

|
AOQ
Average Outgoing Quality
|

|
|
Tell us what you think about AmosWEB. Like what you see? Have suggestions for improvements? Let us know. Click the User Feedback link.
User Feedback
|


|


