
|
|
PERFECT COMPETITION, LONG-RUN EQUILIBRIUM CONDITIONS: The long-run equilibrium of a perfectly competitive industry generates six specific equilibrium conditions, including: (1) economic efficiency (P = MC), (2) profit maximization (MR = MC), (3) perfect competition (MR = AR = P), (4) breakeven output (P = AR = ATC), (5) minimum production cost (MC = ATC), and (6) minimum efficient scale (MC = ATC = LRAC = LRMC).
Visit the GLOSS*arama
|
|


|

|
                           AVERAGE REVENUE CURVE, MONOPOLY: A curve that graphically represents the relation between average revenue received by a monopoly for selling its output and the quantity of output sold. Because average revenue is essentially the price of a good, the average revenue curve is also the demand curve for a monopoly's output. Monopoly is a market structure with a single firm selling a unique good. As the only firm in the market, monopoly is a price maker and has extensive market control, facing a negatively-sloped demand curve. If a monopoly wants to sell a larger quantity, then it must lower the price.The average revenue curve reflects the degree of market control held by a firm. For a perfectly competitive firm with no market control, the average revenue curve is a horizontal line. For firms with market control, especially monopoly, the average revenue curve is negatively-sloped. Average Revenue Curve,
Medicine Style | 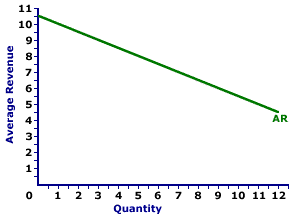 |
The average revenue curve for Feet-First Pharmaceutical is displayed in the exhibit to the right. Key to this curve is that Feet-First Pharmaceutical is a monopoly provider of Amblathan-Plus and thus faces a negatively-sloped demand curve. Larger quantities of output are only possible with lower prices.The vertical axis measures average revenue and the horizontal axis measures the quantity of output (ounces of medicine). Although quantity on this particular graph stops at 12 ounces of medicine, it could go higher. This curve indicates that if Feet-First Pharmaceutical sells 1 ounce of medicine (at $10 per ounce), then average revenue is $10 per ounce. Alternatively, if it sells 10 ounces (at $5.50 per ounce), then average revenue in is $5.50 per ounce. Should it sell 12 ounces (at $4.50 per ounce), then average revenue is $4.50 per ounce. For Feet-First Pharmaceutical the average revenue curve is also the demand curve. The curve is negatively sloped, meaning that larger quantities of output result in less average revenue. Although this average revenue curve, and preceding table of average revenue numbers, is based on the production activity of Feet-First Pharmaceutical, a well-known monopoly firm, they apply to any firm with market control. Monopolistic competition and oligopoly firms that also face negatively-sloped demand curves generate comparable average revenues.
Recommended Citation:AVERAGE REVENUE CURVE, MONOPOLY, AmosWEB Encyclonomic WEB*pedia, http://www.AmosWEB.com, AmosWEB LLC, 2000-2025. [Accessed: July 18, 2025].
Check Out These Related Terms... | | | | | | | | |
Or For A Little Background... | | | | | | | | | | | |
And For Further Study... | | | | | | | | |
Related Websites (Will Open in New Window)... | | | |
Search Again?
Back to the WEB*pedia
|

|

|
GRAY SKITTERY
[What's This?]
Today, you are likely to spend a great deal of time driving to a factory outlet wanting to buy either a coffee cup commemorating yesterday or a replacement remote control for your television. Be on the lookout for a thesaurus filled with typos.
Your Complete Scope
This isn't me! What am I?
|

|
|
The first paper notes printed in the United States were in denominations of 1 cent, 5 cents, 25 cents, and 50 cents.
|

|
|
"A winner is someone who recognizes his God-given talents, works his tail off to develop them into skills, and uses those skills to accomplish his goals. " -- Larry Bird, basketball player
|

|
W
Wage
|

|
|
Tell us what you think about AmosWEB. Like what you see? Have suggestions for improvements? Let us know. Click the User Feedback link.
User Feedback
|

|

