
|
|
ABSOLUTE POVERTY: The amount of income a person or family needs to purchase an absolute amount of the basic necessities of life. These basic necessities are identified in terms of calories of food, BTUs of energy, square feet of living space, etc. The problem with the absolute poverty level is that there really are no absolutes when in comes to consuming goods. You can consume a given poverty level of calories eating relatively expensive steak, relatively inexpensive pasta, or garbage from a restaurant dumpster. The income needed to acquire each of these calorie "minimums" vary greatly. That's why some prefer relative poverty.
Visit the GLOSS*arama
|
|


|

|
                           MARGINAL UTILITY AND DEMAND: An explanation of the law of demand and the negatively-sloped demand curve based on utility analysis and the law of diminishing marginal utility. The law of diminishing marginal utility states that marginal utility declines as consumption increases. Because demand price depends on the marginal utility obtained from a good, price also declines as consumption increases, meaning price and quantity demanded are inversely related, which is the law of demand. Marginal utility and the law of diminishing marginal utility can be used to provide insight into market demand, the law of demand, and the demand curve. This insight rests on two propositions.- One, the law of diminishing marginal utility means that the marginal utility obtained from consuming a good declines as the quantity consumed increases.
- Two, the marginal utility of a good underlies the demand price that buyers are willing and able to pay for a good.
When combined, these two propositions indicate the demand price that buyers are willing and able to pay for a good declines as the quantity demanded (and consumed) increases, which is the law of demand. Starting with Utility| Edgar Rides the Coaster | 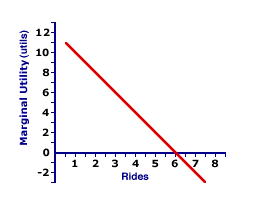 |
The graph displayed at the right is Edgar Millbottom's marginal utility curve for riding the Monster Loop Death Plunge roller coaster during a day at the Shady Valley Amusement Park. By transforming this curve ever so slightly, Edgar's demand curve for roller coaster rides can be derived.But first, consider the marginal utility curve itself. - The vertical axis measures marginal utility in utils and the horizontal axis measures quantity in rides on the roller coaster.
- The marginal utility curve has a negative slope, illustrating the law of diminishing marginal utility.
- Marginal utility curve intersects the horizontal axis at 6 rides. Marginal utility is positive up to that point, then becomes negative after.
The task at hand is to transform this marginal utility curve into a demand curve. To do this, though, a little more information is needed.Adjusting the RuleAccording to the rule of consumer equilibrium, people like Edgar buy goods such that the marginal utility-price ratio for each good is equal, satisfying this equation: marginal utility of good 1
price of good 1 | = | marginal utility of good 2
price of good 2 |
However, in the derivation of Edgar's demand curve for roller coaster rides, the key comparison is not between roller coaster rides and ONE other good, but with ALL other alternatives. The big assumption, therefore, is that Edgar achieves consumer equilibrium and satisfies this rule of consumer equilibrium for ALL other goods. If so, then Edgar has a "standard" or "benchmark" marginal utility-price ratio. For the sake of exposition, suppose that Edgar's benchmark marginal utility-price ratio is 2 utils per dollar. In other words, Edgar purchases all sorts of different goods such that the last dollar spent on each good generates 2 utils of satisfaction. It this case, it is possible to specify the rule of consumer equilibrium as: marginal utility of roller coaster rides
price of roller coaster rides | = | marginal utility of all other goods
price of all other goods | = 2 utils per dollar |
If this equation is rearranged just a little, the result is: marginal utility of roller coaster rides
2 utils per dollar | = | price of roller coaster rides |
The beauty of this equation is that the price that Edgar is willing and able to pay for roller coaster rides (his demand price) is now connected to the marginal utility derived from those rides. Making the Conversion| The Conversion | |
In terms of the original marginal utility graph, dividing the marginal utility on the vertical axis by 2 utils per dollar transforms the marginal utility curve into a demand curve. Click the [Demand Curve] button to make this happen.Not much changes upon clicking the [Demand Curve] button. One change is the measurement units on the vertical axis from utils to dollars. The other change is the elimination of that part of the curve in the negative range of marginal utility and price (negative prices are not relevant). Feel fee to click the [Reset] and [Demand Curve] buttons a couple of times to confirm that not much changes. Multiple button clicks should serve to emphasize that the marginal utility curve and the demand curve are closely related, that demand is based on marginal utility, and that the law of diminishing marginal utility is the foundation for the law of demand.
Recommended Citation:MARGINAL UTILITY AND DEMAND, AmosWEB Encyclonomic WEB*pedia, http://www.AmosWEB.com, AmosWEB LLC, 2000-2025. [Accessed: July 1, 2025].
Check Out These Related Terms... | | | | | |
Or For A Little Background... | | | | | | | | |
And For Further Study... | | | | | | | | | | | | | | | |
Search Again?
Back to the WEB*pedia
|

|

|
WHITE GULLIBON
[What's This?]
Today, you are likely to spend a great deal of time waiting for visits from door-to-door solicitors looking to buy either a coffee cup commemorating the first day of winter or a video game player. Be on the lookout for malfunctioning pocket calculators.
Your Complete Scope
This isn't me! What am I?
|

|
|
Two and a half gallons of oil are needed to produce one automobile tire.
|

|
|
"Experience keeps a dear school, but fools will learn in no other. " -- Benjamin Franklin
|

|
WIPO
World Intellectual Property Organization
|

|
|
Tell us what you think about AmosWEB. Like what you see? Have suggestions for improvements? Let us know. Click the User Feedback link.
User Feedback
|

|

