|
|
DISCRIMINATION: Treating people differently based on some sort of group characteristic--like race, ethnic origin, or gender--rather then individual abilities. Discrimination is usually most prominent in employment and housing, but can filter into all aspects of life in many subtle ways. Discrimination tends to be inefficient because it limits the number of buyers or sellers that have access to a given market. Those who discriminate in this manner are, in essence, willing to pay extra for the privilege of associating only with "their own kind."
Visit the GLOSS*arama
|
|


|

|
                           TOTAL UTILITY CURVE: A curve illustrating the relation between the total utility obtained from consuming a good and the quantity of the good consumed. The shape of the total utility curve, increasing at a decreasing rate, reflects the law of diminishing marginal utility. The reason for this is that slope of the total utility curve is marginal utility, meaning the total utility curve can be use to derive the marginal utility curve. The total utility curve is a cornerstone for consumer demand theory and utility analysis. It graphically captures the overall relation between the utility generated from a good and the quantity of the good consumed. This relation can them be used to derive marginal utility, which is critical to an understanding of market demand and the law of demand.| Roller Coaster Utility |  |
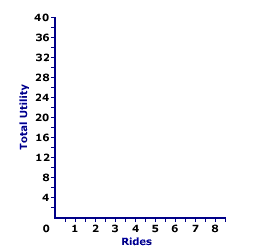
To set the stage for the total utility curve, consider the table of total utility values presented here. This table reports the total utility generated when Edgar Millbottom, Shady Valley's resident roller coaster aficionado, spends the day riding the Monster Loop Death Plunge roller coaster at the local Shady Valley Amusement Park. Edgar takes 8 separate rides on the Monster Loop Death Plunge roller coaster, graciously recording the total utility he accumulates after each ride.The task at hand is to plot these values into a graph. The graph below is ideally suited for the construction of the total utility curve for Edgar's 8 rides on the Monster Loop Death Plunge roller coaster. | Deriving Total Utility Curve |  |
First, a few words about the existing graph. - The joined axes at the right present the plotting area.
- The horizontal axis measures quantity, the number of rides on the roller coaster. This ranges from 0 to 8.
- The vertical axis measures total utility, in utils, ranging from 0 to 40.
The next step is relatively easy. Click the "Plot" button to plot points indicating the total utility associated with each ride on the roller coaster. - If there are no rides, then total utility is 0 utils.
- After one ride, total utility 11 utils.
- After two rides, total utility 20 utils.
- After three ride, total utility 27 utils.
- And on it goes...
If the quantity consumed is continuously divisible, rather than coming in discrete amounts, then these nine points represent nine of an infinite number that capture the relation between total utility and quantity. To illustrate the other possible points, click the [Curve] button. The resulting line is the total utility curve.Consider these three observations about the curve. - The curve begins at the origin. If Edgar does not ride, then he receives no utility.
- The total utility curve is shaped something like a hill. It increases for the first 6 rides, then decreases for the rides 7 and 8. In general, Edgar's utility increases when he consumes a larger quantity.
- The total utility curve reaches a peak of 36 utils at 6 rides. This is the number of rides that maximizes Edgar's utility.
In closing, take note of the slope of the total utility curve. It rises, flattens, then turns negative. The slope of this total utility curve is marginal utility. The shape of the total utility curve means that marginal utility is high for small quantities, declines, then becomes negative as the quantity consumed increases. This decline in marginal utility and the flattening slope of the total utility curve reflect the law of diminishing marginal utility.

Recommended Citation:TOTAL UTILITY CURVE, AmosWEB Encyclonomic WEB*pedia, http://www.AmosWEB.com, AmosWEB LLC, 2000-2025. [Accessed: June 30, 2025].
Check Out These Related Terms... | | | |
Or For A Little Background... | | | | | | |
And For Further Study... | | | | | | | | | | | | | | | |
Search Again?
Back to the WEB*pedia
|


|

|
PURPLE SMARPHIN
[What's This?]
Today, you are likely to spend a great deal of time searching for rummage sales seeking to buy either a birthday greeting card for your mother that doesn't look like a greeting card or a handcrafted spice rack. Be on the lookout for vindictive digital clocks with revenge on their minds.
Your Complete Scope
This isn't me! What am I?
|

|
|
In his older years, Andrew Carnegie seldom carried money because he was offended by its sight and touch.
|

|
|
"I learned about the strength you can get from a close family life. I learned to keep going, even in bad times. I learned not to despair, even when my world was falling apart. I learned that there are no free lunches. And I learned the value of hard work. " -- Lee Iacocca
|

|
LWP
Leave With Pay
|

|
|
Tell us what you think about AmosWEB. Like what you see? Have suggestions for improvements? Let us know. Click the User Feedback link.
User Feedback
|


|


