Average revenue is the revenue generated per unit of output sold. It plays a role in the determination of a firm's profit. Per unit profit is average revenue minus average (total) cost. A firm generally seeks to produce the quantity of output that maximizes profit.The relation between average revenue and quantity of output produced depends on market structure. For a perfectly competitive firm, average revenue is not only equal to price, but more importantly, it is equal to marginal revenue, all of which are constant. For a monopoly, monopolistically competitive, or oligopoly firm, average revenue is greater than marginal revenue, both of which decrease with larger quantities of output. The constant or decreasing nature of average revenue is a prime indication of the market control of a firm.
Average revenue can be represented in a table or as a curve. For a perfectly competitive firm, the average revenue curve is a horizontal, or perfectly elastic, line. For a monopoly, oligopoly, or monopolistically competitive firm, the average revenue curve is negatively sloped. In each case, the average revenue curve is also the demand curve facing the firm.
The average revenue received by a firm is total revenue divided by quantity, often expressed as this simple equation:
| average revenue | = | total revenue
quantity |
At times, it can be helpful to turn this equation around and calculate total revenue from average revenue:
| total revenue | = | average revenue | x | quantity |
Perfect Competition
Perfect competition is a market structure with a large number of small firms, each selling identical goods. Perfectly competitive firms have perfect knowledge and perfect mobility into and out of the market. These conditions mean perfectly competitive firms are price takers, they have no market control and receive the going market price for all output sold.Average Revenue,
Zucchini Style |  |
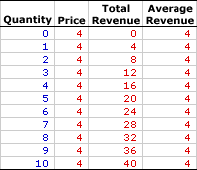
The table to the right summarizes the average revenue received by a hypothetical firm, Phil the zucchini grower, for selling zucchinis in a perfectly competitive zucchini market. The first column is the quantity of zucchinis sold, ranging from 0 to 10 pounds. The second column is then the price Phil receives for selling his zucchinis, which is $4 per pound. The third column is the total revenue Phil receives for producing and selling alternative quantities of zucchinis. Average revenue in the forth column is found by dividing total revenue in the third column by quantity in the first column. For example, because the total revenue generated from the production of 5 pounds of zucchinis is $20, average revenue is $4 (= $20/5). Each value in the fourth column is calculated in the same way.
The obvious point is that average revenue is equal to $4 for each and every pound of zucchinis sold. The reason is that price is constant at $4 for each and every pound of zucchinis sold. Average revenue is price. Price is average revenue. The two are one and the same.
Average Revenue Curve,
Zucchini Style |  |
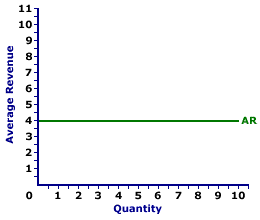
Average revenue is commonly represented by an average revenue curve, such as the one displayed in the exhibit to the right. This particular average revenue curve is that for zucchini sales by Phil the zucchini grower, a presumed perfectly competitive firm. The vertical axis measures average revenue and the horizontal axis measures the quantity of output (pounds of zucchinis). Although quantity on this particular graph stops at 10 pounds of zucchinis, the nature of perfect competition indicates it could easily go higher.
This curve indicates that if Phil sells 1 pound of zucchinis, then his revenue per unit is $4. However, if he sells 10 pounds, then he also receives $4 of average revenue. Should he sell 100 pounds, then he moves well beyond the graph, but his average revenue remains at $4.
The average revenue curve is actually the demand curve for Phil's zucchinis. In fact, in the same way that average revenue is just another term for price, the average revenue curve is just another term for demand curve.
Monopoly, Oligopoly, and Monopolistic Competition
While conceptually average revenue is the same for market structures like monopoly, oligopoly, and monopolistic competition, because these firms are price makers rather than price takers, there are a few key differences. Market control means these market structures face negatively-sloped demand curves. As such, the price received is not fixed, but depends on the quantity of output sold, and so too does average revenue.Average Revenue,
Medicine Style |  |
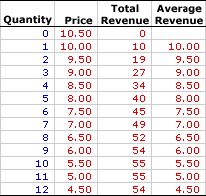
The table to the right summarizes the average revenue received by another hypothetical firm, Feet-First Pharmaceutical. This firm owns the patent to Amblathan-Plus, the only cure for the deadly foot ailment known as amblathanitis. As the only producer of Amblathan-Plus, Feet-First Pharmaceutical is a monopoly with extensive market control, facing a negatively-sloped demand curve. To sell a larger quantity of Amblathan-Plus, Feet-First Pharmaceutical must lower the price.The first column is the quantity of Amblathan-Plus sold, ranging from 0 to 12 ounces. The second column is the price Feet-First Pharmaceutical receives for selling this medicine, which ranges from $4.50 to $10.50 per ounce. The third column is the total revenue Feet-First receives for producing and selling this medicine.
Average revenue in the forth column is found by dividing total revenue in the third column by quantity in the first column. For example, because the total revenue generated from the production of 5 ounces of Amblathan-Plus is $40, average revenue is $8 (= $40/5). Each value in the fourth column is calculated in the same way.
The obvious point is that average revenue decreases with the quantity of medicine produced. Moreover, average revenue is also equal to the price of Amblathan-Plus for each quantity sold. The price of 5 ounces of Amblathan-Plus is $8 and the average revenue for 5 ounces is also $8. Average revenue is price. Price is average revenue. The two are one and the same.
Average Revenue Curve,
Medicine Style |  |
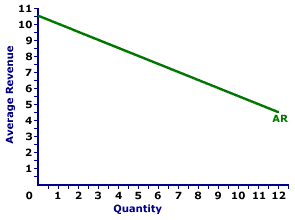
The average revenue curve for firms with market control looks a little different than that for perfect competition. The average revenue curve for Feet-First Pharmaceutical is displayed in the exhibit to the right. Key to this curve is that Feet-First Pharmaceutical is a monopoly provider of Amblathan-Plus and thus faces a negatively-sloped demand curve. Larger quantities of output are only possible with lower prices.The vertical axis measures average revenue and the horizontal axis measures the quantity of output (ounces of medicine). Although quantity on this particular graph stops at 12 ounces of medicine, it could go higher.
This curve indicates that if Feet-First Pharmaceutical sells 1 ounce of medicine (at $10 per ounce), then average revenue is $10 per ounce. Alternatively, if it sells 10 ounces (at $5.50 per ounce), then average revenue in is $5.50 per ounce. Should it sell 12 ounces (at $4.50 per ounce), then average revenue is $4.50 per ounce.
For Feet-First Pharmaceutical the average revenue curve is also the demand curve. The curve is negatively sloped, meaning that larger quantities of output result in less average revenue.
Although this average revenue curve, and preceding table of average revenue numbers, is based on the production activity of Feet-First Pharmaceutical, a well-known monopoly firm, they apply to any firm with market control. Monopolistic competition and oligopoly firms that also face negatively-sloped demand curves generate comparable average revenues.
AVERAGE REVENUE, AmosWEB Encyclonomic WEB*pedia, http://www.AmosWEB.com, AmosWEB LLC, 2000-2025. [Accessed: July 18, 2025].


